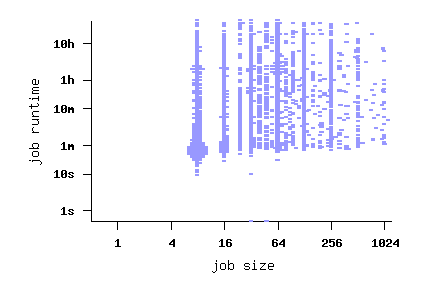
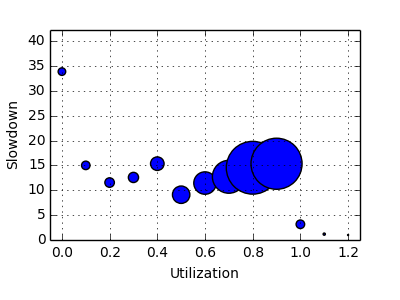
The San Diego Supercomputer Center (SDSC) Blue Horizon log
| System: | 144-node IBM SP, with 8 processors per node |
| Duration: | Apr 2000 thru Jan 2003 |
| Jobs: | 250,440 |
An extensive log, starting when the machine was just installed, and
then covering more than two years of production use.
It contains information on the requested and used nodes and time, CPU
time, submit, wait and run times, and user.
The workload log from the SDSC Blue Horizon was graciously
provided by Travis Earheart and Nancy Wilkins-Diehr,
who also helped with background information and interpretation.
If you use this log in your work, please use a similar acknowledgment.
Downloads:
(May need to click with right mouse button to save to disk)
|
|
System Environment
The total machine size is 144 nodes.
Each is an 8-way SMP with a crossbar connecting the processors to a
shared memory.
These nodes are for batch use, with jobs submitted using LoadLeveler.
The data available here comes from LoadLeveler.
The log also contains interactive jobs up to July 2002.
At about that time an additional 15 nodes were acquired for
interactive use, e.g. development.
These nodes have only ethernet communication, employ timesharing scheduling,
and reportedly have only 4 processors each.
These nodes are handled by a separate instance of LoadLeveler, and
their workload is not available here.
The scheduler used on the machine is called Catalina.
This was developed at SDSC, and is similar to other batch schedulers.
It uses a priority queue, performs backfilling, and supports reservations.
Jobs are submitted to a set of queues.
The main ones are
| Name | Time limit | Node limit |
| interactive | 2hr | 8 |
| express | 2hr | 8 |
| high | 36hr | -- |
| normal | 36hr | -- |
| low | -- | -- |
According to on-line documentation, towards the end of 2001 the limits
were different:
| Name | Time limit | Node limit |
| interactive | 2hr | -- |
| express | 2hr | 8 |
| high | 18hr | 31 |
| normal | 18hr | 31 |
| low | 18hr | 31 |
For more information see the
NPACI user guide.
Log Format
The original log is available as SDSC-BLUE-2000-0.
This was originally provided as three separate yearly files, which
have been concatanated to produce this file.
The data contains one line per job with the following white-space
separated fields:
- User (sanitized as User1, User2, ...)
- Queue (interactive, express, high, normal, low, unknown)
- Total CPU time
- Wallclock time
- Service units (used in accounting)
- Nodes used
- Maximal nodes used
- Number of jobs run (always 1)
- Max memory (unused)
- Memory (unused)
- I/O (unused)
- Disk space (unused)
- Connect time (unused)
- Waiting time
- Slowdown
- Priority (maps to queue)
- Submit date and time
- Start date and time
- End date and time
- Requested wallclock time
- Requested memory (unused)
- Requested nodes
- Completion status
Conversion Notes
The converted log is available as SDSC-BLUE-2000-4.swf.
The conversion from the original format to SWF was done subject to the following.
- The original log specifies the number of nodes each job requested
and received.
In the conversion this was multiplied by 8 to get the number of processors.
- The original log contains dates and times in human-readable
format, e.g. 2000-12-28--22:58:35.
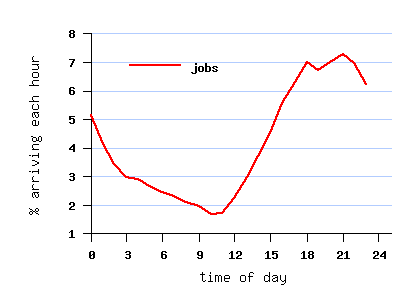
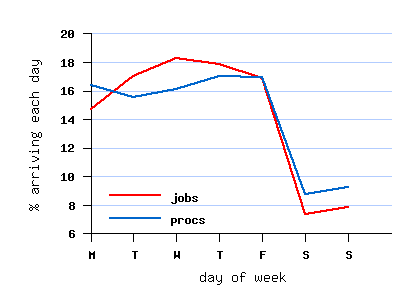
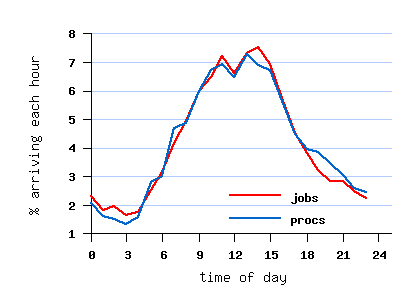
However, the submit times create a daily cycle which peaks at
night (see graph below),
probably due to inconsistent use of the gmtime and localtime
functions when the data was collected.
Therefore the default San Diego time-zone shift of 8 hours was
postulated.
This was implemented by using timegm rather than timelocal to
produce a UTC timestamp.
- The original log contains some fields that can be used for sanity
checks, but seem to be unreliable.
For example, the wallclock field is often less than the difference
between the start and end times, and also the CPU time.
The wait time field also does not necessarily match the difference
between the start and submit times.
These discrepancies were ignored.
-
The conversion loses the following data, that cannot be represented in
the SWF:
- The maximal number of nodes used.
In 184 jobs this was lower than the number of nodes allocated.
- The priority and service unites.
Note that the priority is not a job-specific priority but rather the priority
of the queue to which it was submitted.
The service units charged are the product of wallclock time and priority (times 8).
-
The following anomalies were identified in the conversion:
- 458 jobs got more processors than they requested.
In some (but not all) cases this seems to be rounding up to a power of 2.
- 253 jobs got less processors than they requested.
- 23,491 jobs got more runtime than they requested.
In 8,167 cases the extra runtime was larger than 1 minute.
- 12140 jobs with "failed" status had undefined start times.
In 262 of them the start time and run time were approximated using CPU time.
- 25,735 jobs were recorded as using 0 CPU time; this was changed to -1.
4203 of them had "success" status.
- 15 jobs had an average CPU time higher than their runtime.
In 2 cases the extra CPU time was larger than 1 minute.
- 20,773 jobs were recorded as using 0 processors, of which 20771
had a status of "cancelled". This was changed to -1
- 792 jobs enjoyed a negative wait time (start time was before
submit time), and for 28 the difference was more than 1 minute.
It is assumed that this is the result of unsynchronized clocks.
These wait times were changed to 0, effectively shifting the start
(and end) times.
- in 2 jobs the status was missing.
The conversion was done by
a log-specific parser
in conjunction with a more general
converter module.
The differences between conversion 4 (reflected in SDSC-BLUE-2000-4.swf)
and conversion 3 (SDSC-BLUE-2000-3.swf) are mainly due to new logic to
handle inconsistent times.
For example, in conversion 3 when negative wait times were encountered
the submit time was moved back, but in converion 4 it is not
(effectively shifting the start and end times instead).
The differences between conversion 3 (reflected in SDSC-BLUE-2000-3.swf)
and conversion 2 (SDSC-BLUE-2000-2.swf) are
- In conversion 2 there were 36 instances where jobs were not sorted
by their arrival time.
This was corrected in conversion 3.
- In conversion 2 only 7 different queue names were used.
Conversion 3 retains all the different queue names that appear in
the original data.
- In conversion 2 many cancelled jobs were marked as using 0
processors and 0 CPU time.
These were changed to -1 in conversion 3.
The differences between conversion 2 (reflected in SDSC-BLUE-2000-2.swf)
and conversion 1 (SDSC-BLUE-2000-1.swf) are
- In conversion 1, cancelled jobs were marked as status 0 (failed).
In conversion 2 this was changed to status 5.
Usage Notes
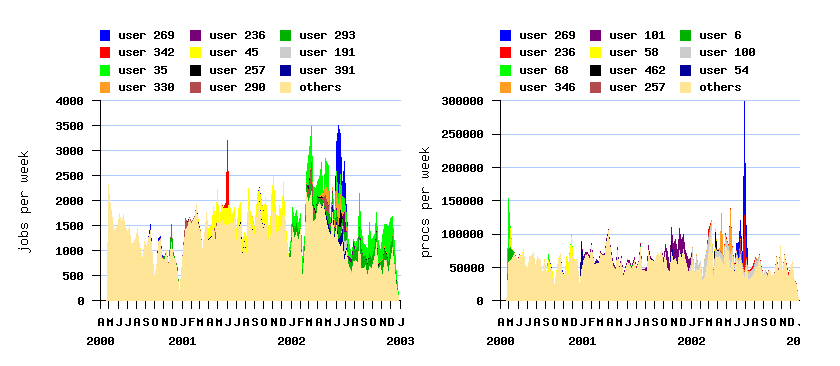
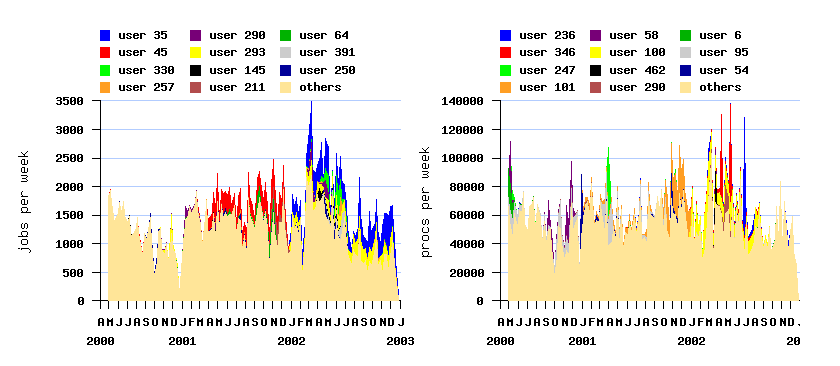
The original log contains several flurries of very high activity by individual
users, which may not be representative of normal usage.
These were removed in the cleaned version, and it is recommended that this version be used.
In addition, the first 8 jobs were removed.
The cleaned log is available as SDSC-BLUE-2000-4.2-cln.swf.
A flurry is a burst of very high activity by a single
user.
The filters used to remove the three flurries that were identified are
user=68 and job>57 and job<565 (477 jobs)
user=342 and job>88201 and job<91149 (1468 jobs)
user=269 and job>200424 and job<217011 (5181 jobs)
Removing the first 8 jobs was added in the second cleaned version, as
they seem to represent activity from long before the actual logging
started.
Note that the filters were applied to the original log, and unfiltered
jobs remain untouched.
As a result, in the filtered logs job numbering is not consecutive and
does not start from 1.
Further information on flurries and the justification for removing
them can be found in:
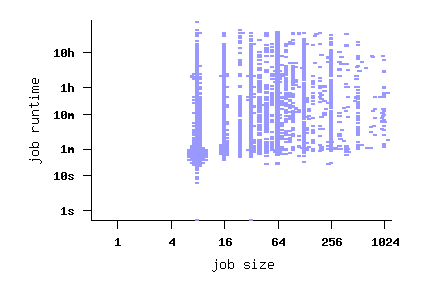
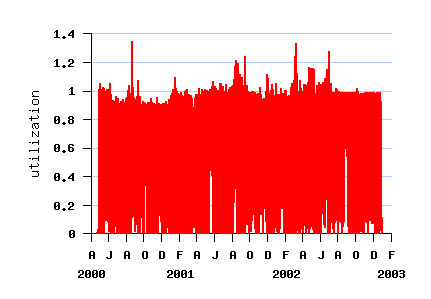
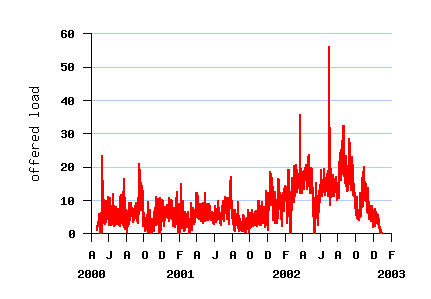
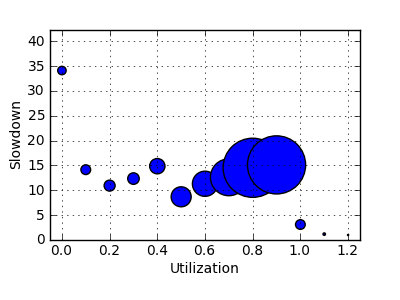
The Log in Graphics
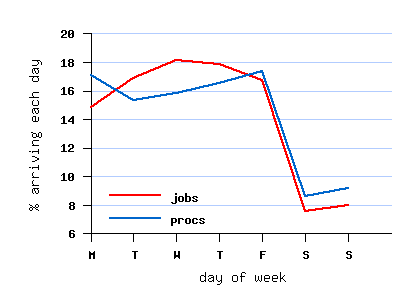
File SDSC-BLUE-2000-0 (before conversion)

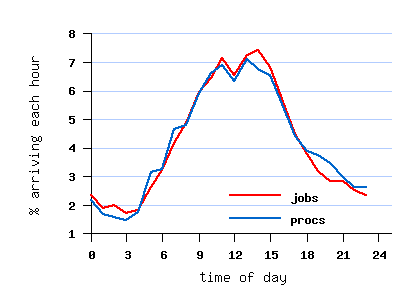
File SDSC-BLUE-2000-4.swf


File SDSC-BLUE-2000-4.2-cln.swf (cleaned)


Parallel Workloads Archive - Logs
